
For people within the waterpower industry, no three names are more synonymous with hydropower than Francis, Kaplan and Pelton – the three primary types of turbine technology. Turbines, of course, serve as the heartbeat for hydropower projects, transferring the energy from moving water to generate electricity. And from 2010-2019, nearly 12 gigawatts of hydropower turbine capacity has been installed in the U.S, in the form of upgrading existing facilities or new project builds.
At a more macrolevel, for U.S. turbine manufacturers, from 2015–2019 the trade balance for imports was $279 million, while exports represented $263 million. During this period, China, Canada, and Brazil were the top three countries for imported turbines and parts. For exports, Canada and Mexico accounted for 51% of turbines shipped out of the country.
These findings, which were produced by the Department of Energy’s Waterpower Technology Office in its recently released January 2021 edition of the U.S. Hydropower Market Report, provides the most up-to-date information on the hydropower turbine industry.
Why It Matters
Understanding the U.S. hydropower turbine supply chain offers a glimpse into not only the scope and vitality of the market, but emerging trends in hydropower development. For example, since 2010 the average turbine installations at existing facilities was 50 MW with a median unit size of 16 MW. At the same time, for new project builds the capacities were 7 MW and 1 MW, respectively. As such, the lion’s share of hydropower’s new growth is coming from small hydro projects.
However, the overwhelming bulk of installed turbine capacity over the last decade (12 GW) is coming from repairs and upgrades at existing facilities. In fact, of the 291 turbine installations over that time period, 79% percent occurred at existing facilities and represented 96% of the turbine capacity installed. And since 2010, nearly $8 billion has been invested in upgrading the U.S. hydropower fleet, with almost $2 billion corresponding to projects initiated in 2017–2019. As such, the market for maintaining the current fleet remains a viable market for manufactures.
According to Jeanne Hilsinger, Executive Chairman of Czech-American turbine supplier Mavel, which focusses solely on turbines for small and medium hydroelectric power projects, “We have supplied a mix of Kaplan (60%), Francis (30%) and Modular micro turbines (10%) for a wide variety of project types, including equipment upgrades, new Low Flow Units at existing plants, new projects at existing dam sites and irrigation systems.” She added that with the strong focus on climate change and renewables, turbine suppliers are anticipating an increase in demand in all global markets for a wide variety of project types. Policy will pick the winners. The United States, with the right policies in place, could lead the charge.”
Deep Dive
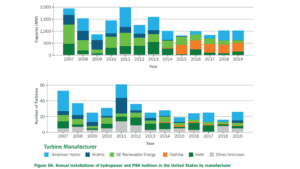
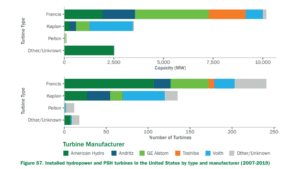
The types of turbines installed over the past decade is particularly fascinating. According to the Market Report, Francis is the most common turbine type, as it represented 56% of units installed. Moreover, fifteen of the 32 installed turbines with capacities greater than 100 MW were Francis units. Kaplan were found to be the second most common type of turbine installed, representing 35% of units installed in the past decade. And since 2010, only 11 Pelton units have been installed with a total capacity of 109 MW.
The type of turbine installed in the past decade also varied based on whether it was for a new plant or a replacement at an existing facility. At new plants, predominantly non-powered dams, Kaplan has been the preferred turbine, making up 72% of turbines installed – total 316 MW or 72%. And since 2010, 35 hydropower projects build on existing non-powered dams have come online.
For turbine replacements at existing plants, 62% of the units were Francis (60% of capacity), while Kaplan units accounted for a 32%.
Given that the majority of turbine installed capacity is repair and upgrades in the last decade, it naturally begs the question: where is it happening in the industry. According to the Market Report, the federal fleet accounted for 17% (73) of turbine units and 27% of capacity. The remainder of the activity was distributed between the public, nonfederal fleet (24% of units) and privately-owned plants (59% of units).
This article just scratches the surface of the trends in the U.S. hydropower turbine industry, we encourage you to read the Market Report for a deep understanding.